前言
Leafer.js 是最近新開源的一個 2D 圖形繪制庫,根據宣傳文章中所言:速度很快,性能極高,資源占用極低。
正好,本來也要記錄一篇開發中在繪圖時應用數學的筆記,同時嘗試一下 leafer.js。
LeaferJS宣傳文章:點擊跳轉
LeaferJS官網:點擊跳轉
官方基于 LeaferJS 實現的半成品:點擊跳轉 wodisign
Leafer 嘗鮮
本篇只是嘗鮮文章,初衷是記錄一篇開發中遇到數學問題的筆記,所以不對過多用法進行講解,如果感興趣的人多,我再另出一篇。
安裝 leafer-ui
Leafer UI 是基于 Leafer 開發的一套 UI 繪圖框架,可結合 AI 繪圖、生成界面,提供了常用的 UI 繪圖組件,后面全部以 leafer 簡稱。
npm install leafer-ui
基本環境
為了方便測試,我直接通過 vue-cli 創建了一個項目
初始化一個 DOM 容器,并設置高度為 100%, 后續所有方法 我們默認放到 nextTick 中執行。
<script setup>
import { nextTick } from 'vue'
nextTick(()=> {})
</script>


<template>
  <main id="main"></main>
</template>


<style scoped>
#main {
  height: 100%;
}
</style>
創建一個應用
這里的創建一個應用,其實就是創建一個實例,或者說是畫布,創建好畫布之后,可以在畫布上進行繪制元素。
創建畫布時可以傳入 width 和 height 規定大小,如果不傳則會自動計算容器的大小。
  const leafer = new Leafer({
// 掛載的元素,支持:window 、div、canvas 標簽對象, 可使用id字符串
    view: 'main',
    // 默認是黑色畫布,我們初始化成白色
    fill: '#fff',
    // 默認是 true, 設置為 false 后需要手動執行 start() 才能渲染
    // 當圖形數量很多,異步創建完后,通過手動 start(),可以加快創建速度。
    start: false
  })
創建一個圖形
Leafer 支持矩形、圓形、多邊形、多角星形、直線
通過這些基礎圖形類型可以延伸出:圓角矩形、橢圓形、三角形、五角星等等...
當實際開發中,可以基于這些圖形組合出各類各樣的復合圖形。
下面我們創建一個簡單的圓形,將創建好的圓形實例添加到畫布中即可
  const masterNode = new Ellipse({
    // x, y 的位置
    x: 100,
    y: 100,
    // 背景色
    fill: '#32cd79',
    // 圖形的寬、高
    width: 300,
    height: 300,
  });
  // 將圖形添加到畫布中
  leafer.add(masterNode);
  leafer.start();
實現效果
完成以上代碼后,此時屏幕左上角會出現一個渲染好的圓形

設置樣式
可以直接通過 masterNode.x=300 的方式進行修改,也可以通過 masterNode.set() 傳入一個對象進行修改
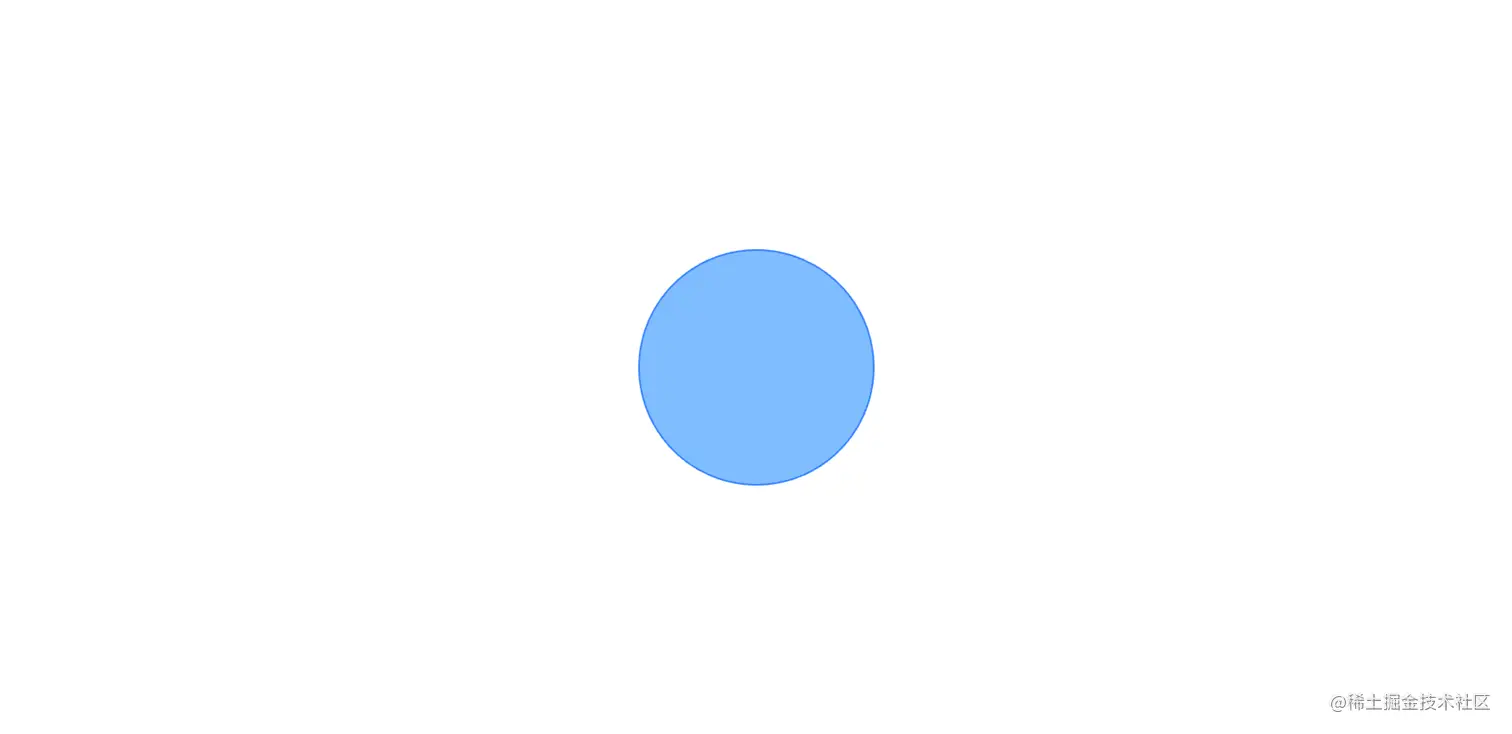
下面這個示例我們將屏幕上的圖形移動到屏幕的正中心
// 獲取當前屏幕的大小
const width = window.innerWidth;
const height = window.innerHeight;


// 我們直接通過 set 方法修改圖形
masterNode.set({
    x: width / 2 - masterNode.width / 2,
    y: height / 2 - masterNode.height / 2,
    // 背景色
    fill: "#91caff",
    // 邊框顏色
    stroke: "#4096ff",
    // 邊框的寬度
    strokeWidth: 2,
})
實現效果
節點平均分布
這是項目上的一個繪圖問題,需求時 多個節點 圍繞著 中心圓 在邊緣進行平均分布。
需求類似于下圖,是多個子節點圍繞著圓心平均分布的網路圖

剛一接到這個需求,就一個頭兩個大,由于節點是動態渲染,個數及內容不定,所以當時我就知道需要通過某種數學公式進行計算點位,然而本來就孱弱的數學,更是早就還給了老師。
實現思路
實際計算圓邊任意點坐標是一個初中數學題,可以使用極坐標轉換和三角函數來計算。
假設圓的圓心坐標為 (x0, y0),半徑為 r,要求的點的角度為 θ(以弧度表示)
將極坐標轉換為直角坐標系中的坐標,使用以下公式計算圓邊上點的直角坐標:
x = x0 + r * cos(θ)
y = y0 + r * sin(θ)
這可以計算出相對于圓心的偏移量,cos(θ) 和 sin(θ) 分別代表給定角度 θ 的余弦和正弦值。
那么通過以上公式,我們只要知道 θ 就可以求出 x , y 的坐標了
我們需要先給定圓心坐標和角度,首先需要將角度轉換為弧度,因為三角函數要求傳入的是弧度。
通過以下公式計算出弧度 θ 的值
弧度 = 角度 * (π / 180)
具體實現
有了上面的實現思路,我們只要提供角度 與 圓心的坐標,即可計算出對應的點位。
同時因為我們需要平均分布,所以每個節點角度是 360 / 節點個數。
const createChildNode = (leafer, masterNode, count) => {
const baseNodeConf = {
width: 40,
height: 40,
fill: "#b5f5ec",
stroke: "#5cdbd3",
strokeWidth: 2,
}
// 平均角度
const baseAngle = 360 / count;
// 計算圓心半徑
const rx = masterNode.width / 2;
const ry = masterNode.height / 2;
// 由于 Leafer 坐標是從左頂點開始,所以要加上半徑才是圓心坐標
const cx = masterNode.x + rx - (baseNodeConf.width / 2);
const cy = masterNode.y + ry - (baseNodeConf.height / 2);
for (let i = 0; i < count; i++) {
// 每個節點的角度
const angle = baseAngle * i;
// 將角度轉換為弧度:θ
const radian = angle * (Math.PI / 180);
// 將極坐標轉換為直角坐標系中的坐標
baseNodeConf.x = cx + rx * Math.cos(radian);
baseNodeConf.y = cy + ry * Math.sin(radian);
const circle = new Ellipse(baseNodeConf)
leafer.add(circle)
}
}
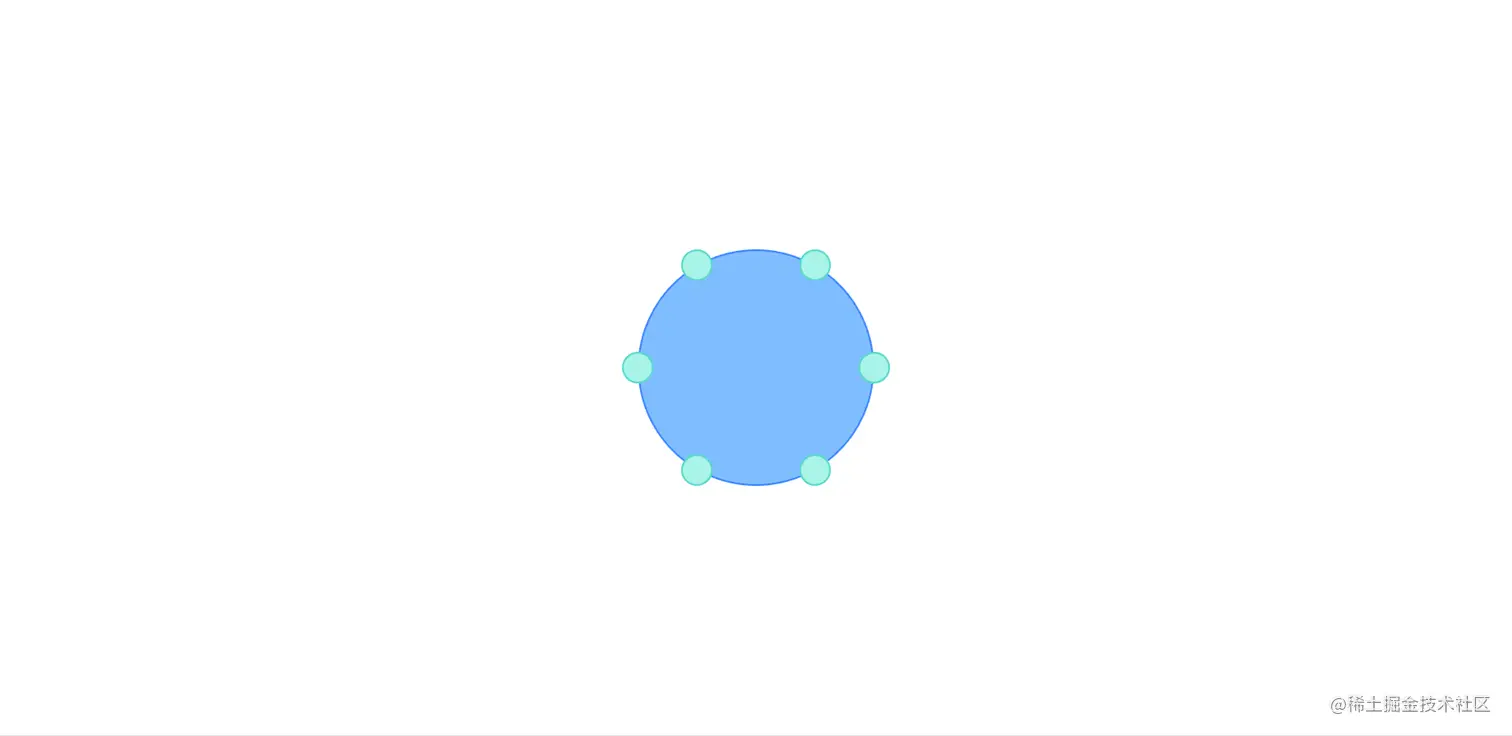
createChildNode(leafer, masterNode, 6)
實現效果
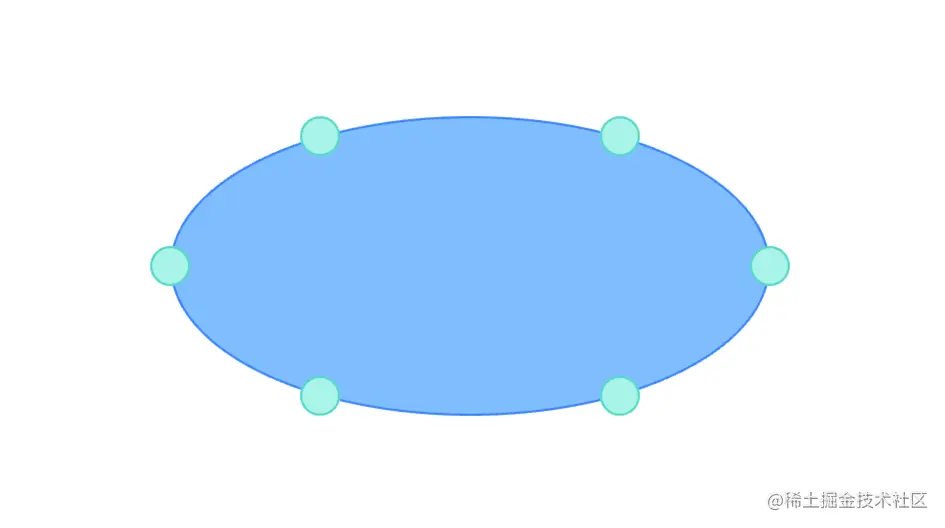
其他示例
對于這套公式,可以任意修改圓的大小及形狀,節點都會平均分布, 例如橢圓形
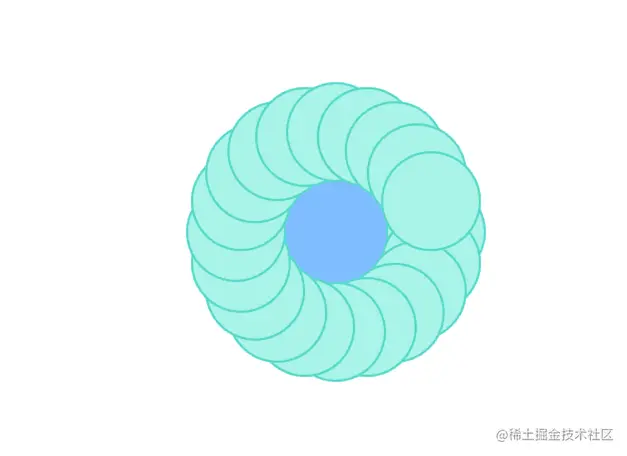
同時,我還組合出了一個有趣的圖形
完整代碼
App.vue
<script setup>
import { nextTick } from 'vue'
import { createGraph } from './graph';
nextTick(()=> createGraph("main"))
</script>


<template>
  <main id="main"></main>
</template>


<style scoped>
#main {
  height: 100%;
}
</style>
graph.js
import { Ellipse, Leafer } from 'leafer-ui';


const createChildNode = (leafer, masterNode, count) => {
  const baseNodeConf = {
    width: 100,
    height: 100,
    fill: "#b5f5ec",
    stroke: "#5cdbd3",
    strokeWidth: 2,
  }
  // 設置基礎角度
  const baseAngle = 360 / count;
  // 圓的半徑
  const rx = masterNode.width / 2;
  const ry = masterNode.height / 2;
  // 圓心坐標
  const cx = masterNode.x + rx - baseNodeConf.width / 2;
  const cy = masterNode.y + ry - baseNodeConf.height / 2;
  for (let i = 0; i < count; i++) {
    // 當前角度
    const angle = baseAngle * i;
    // 將角度轉換為弧度:θ
    const radian = angle * (Math.PI / 180);
    baseNodeConf.x = cx + rx * Math.cos(radian);
    baseNodeConf.y = cy + ry * Math.sin(radian);
    const circle = new Ellipse(baseNodeConf)
    leafer.add(circle)
  }
}


const createGraph = (view) => {
  // 實例應用
  const width = window.innerWidth;
  const height = window.innerHeight - 10;
  // 畫布實例
  const leafer = new Leafer({
    view,
    width,
    height,
    fill: '#fff',
    wheel: { zoomMode: true },
    move: { dragEmpty: true },
    start: false
  })
  // 中心主節點
  const masterNode = new Ellipse({
    width: 200,
    height: 200,
    fill: "#91caff",
    stroke: "#4096ff",
    strokeWidth: 2,
  })
  // 這里單獨設置是為了方便動態計算
  masterNode.set({
    x: width / 2 - masterNode.width / 2,
    y: height / 2 - masterNode.height / 2
  })
  // 添加主節點
  leafer.add(masterNode)
  // 添加環繞子節點
  createChildNode(leafer, masterNode, 20)
  // 啟動應用
  leafer.start()
}


export { createGraph };
作者:子洋
鏈接:https://juejin.cn/post/7252251628090507301
來源:稀土掘金
著作權歸作者所有。商業轉載請聯系作者獲得授權,非商業轉載請注明出處。
該文章在 2024/8/14 9:58:47 編輯過


 400 186 1886


